GraphViz: super graphing tool
Therefore, I will not start any actual implementation work of a microprocessor until I've got the whole design, down to the lowest level, drawn on a piece of paper. Then, when the design works on paper, I will then transfer the design into a computer model, which I can simulate and verify, before implementation. Usually, I would use a physical pen and paper to put my designs down.
I just didn't know of any useful drawing tools to use for my designs. This was fairly troublesome for a later stage, when I would need to write up documentation for the processor as it is difficult to transfer a paper design onto a computer document. So, needless to say, my documentation had little diagrams in it.
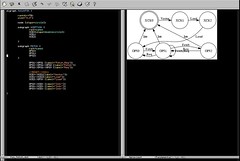
Recently, I had discovered this tool called GraphViz, which is an open source graphing tool that came out of AT&T labs. It is very useful for visualising various concepts. A graph is essentially a diagram with nodes and connections, which is quite similar to a mind-map.
The most interesting thing about this tool is that it doesn't require any 'drawing' skills per se. It's highly structured. So, I just need to describe the structure of a graph into a 'dot' file using it's custom language. Then, hit a compiler and voila, it'll spit out the graphs in various formats including EPS, which can then be directly imported into Latex.
Some people may think that it's easier to use some GUI tool to draw the graphs. However, when using a GUI tool, most of my time is spent fighting with the tool, rather than doing the actual work. This was the case with word processing [that's why I use Latex] and was also the case with diagram tools. Making beautiful graphs has never been easier.
![]()


No comments:
Post a Comment